Token & Cost
A passing test tells you the agent can do the task. It doesn’t tell you what that capability costs. Nasde records, for every trial, how many tokens the agent burned and what that would cost in dollars.
The raw signals
Section titled “The raw signals”Nasde records the raw quality, token, and cost signals you need to compare agents and models:
- token usage — total input + output tokens for the run (price-independent; a measure of how much the model “thinks” to reach a given quality).
- cost (USD) — what those tokens cost at catalog rates. The number that matters when you’re choosing a model for a budget.
These appear in three places: the nasde run summary prints a per-(agent, model, effort) table (trials, score, tokens, $cost — with an inter-trial ±std on cost and tokens once a group has 2+ trials, a bare value at n=1); assessment_summary.json carries them per trial; and results-export copies them into metrics.json.
Quality vs. cost: the Pareto frontier
Section titled “Quality vs. cost: the Pareto frontier”This is the comparison that actually drives a model choice. Nasde measures quality and cost independently so you can see the trade-off — which model gives you the best quality for your budget — instead of collapsing it into one number that hides the picture.
Why not a single “efficiency” ratio (quality per dollar)? Because that ratio has an arbitrary zero — a score of 0 means an empty rubric, which no real run reaches — so the same data can re-order which model “wins” just by shifting where you put that zero. The trade-off is shift-invariant; a single ratio is not.
So Nasde plots the raw signals as a Pareto frontier (quality vs. cost, and quality vs. tokens). Models on the frontier are the best available trade-offs; a model above it is overpaying for its quality, one below it is buying cheap quality. You pick the point on the frontier that matches your budget and quality bar.
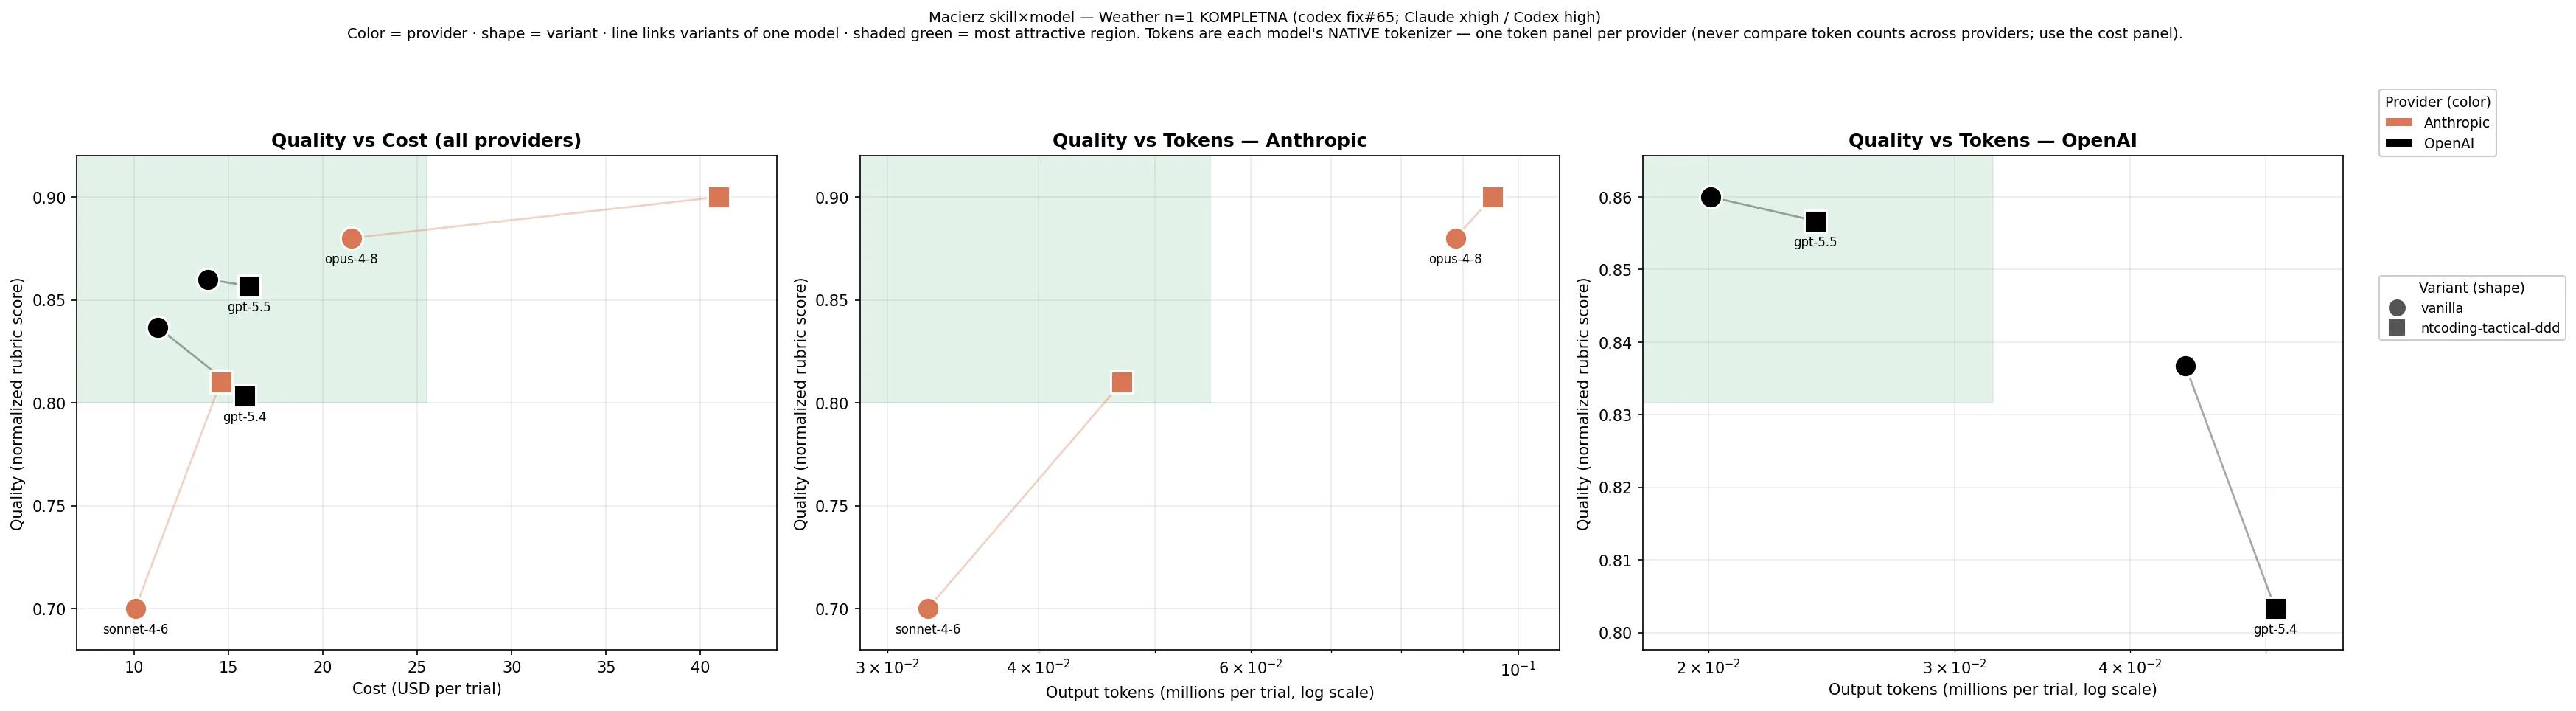
A real example from a skill×model matrix. Left panel — quality vs. cost (USD), all providers together, because dollars are a fair common unit. Color is the provider, marker shape is the variant (circle = vanilla, square = with the skill), and a line links a model’s variants. The shaded region is the most attractive corner (high quality, low cost). The two right panels are quality vs. tokens, one per provider — token counts use each provider’s native tokenizer and are not comparable across providers, so they never share a panel. Reading the left panel, gpt-5.4 and sonnet-4-6 sit cheap-but-lower, opus-4-8 buys the top score at the highest cost — which one “wins” depends entirely on where your budget and quality bar fall.
The Pareto comparison and the chart generator live in the nasde-benchmark-runner skill.
Why scores come with a ± (and why that matters)
Section titled “Why scores come with a ± (and why that matters)”A benchmark score is never perfectly repeatable — run the same setup twice and you’ll get slightly different numbers. So a bare average can lie: if config A scores 0.82 and config B scores 0.80, is A really better, or did it just get lucky this time? To answer that honestly, you need to know how much the score wobbles. That’s why Nasde always reports a score as mean ±std — the average, plus the typical wobble around it.
There are two separate sources of wobble, and Nasde keeps them apart on purpose:
-
The agent writes different code each time. Ask the same agent to solve the same task twice and it won’t produce identical code, so the scores differ. This wobble shows up as the
±stdin the run summary table, measured across your attempts (theTrialscolumn is how many attempts went into the average). Run more attempts —--attempts— and this estimate gets sharper. A single attempt is shown honestly asmean (n=1), not a fake±0.00. -
The judge scores the same code slightly differently each time. Even on identical code, the reviewer isn’t perfectly consistent. This is a different wobble, so it’s recorded per trial in
metrics.json(score_eval_std,score_eval_n).
Why split them? Because the question you actually care about is: is the gap between two configs bigger than the wobble, or is it just noise? Keeping the two sources separate lets you answer that — a 0.02 gap means nothing if each score wobbles by ±0.08. (Formal significance testing is a separate, offline step; Nasde’s job here is to surface the spread and sample size that make an average trustworthy in the first place.)
How the cost is calculated — “as if every run were the first”
Section titled “How the cost is calculated — “as if every run were the first””The dollar figure Nasde reports is deliberately consistent: run the same task ten times and you’ll get the same cost ten times. That’s on purpose, and here’s why it matters.
Most providers give a discount for prompt caching — if you send the same prompt again soon after, the repeated part is cheaper. That sounds good, but it makes cost unpredictable for comparison: the exact same run can cost more or less depending on whether your cache happened to be “warm” (recently used) or “cold”. You’d be comparing models on luck, not on how much they actually cost.
So Nasde ignores the cache discount entirely and prices every run as if it were the very first one — the full prompt billed at the full catalog rate, every time. The model’s reasoning tokens (the “thinking” some models do) are counted as output. The result is a cost number that depends only on the model and the task, not on timing — so when you compare two models, you’re comparing them fairly.
Where pricing comes from
Section titled “Where pricing comes from”Rates live in a small, versioned pricing.toml bundled with Nasde, each model stamped with the date and source it came from. A model entry looks like:
[models."your-model-id"]input_per_1m = 3.0output_per_1m = 15.0as_of = "2026-06-08"source = "https://…"A model that isn’t in the catalog still gets token metrics — only its cost_usd is left blank (with a warning), never a wrong number.