Reading Your Results
Your first nasde run finishes and prints a table, then writes a pile of files. Here’s how to read both.
What a run looks like
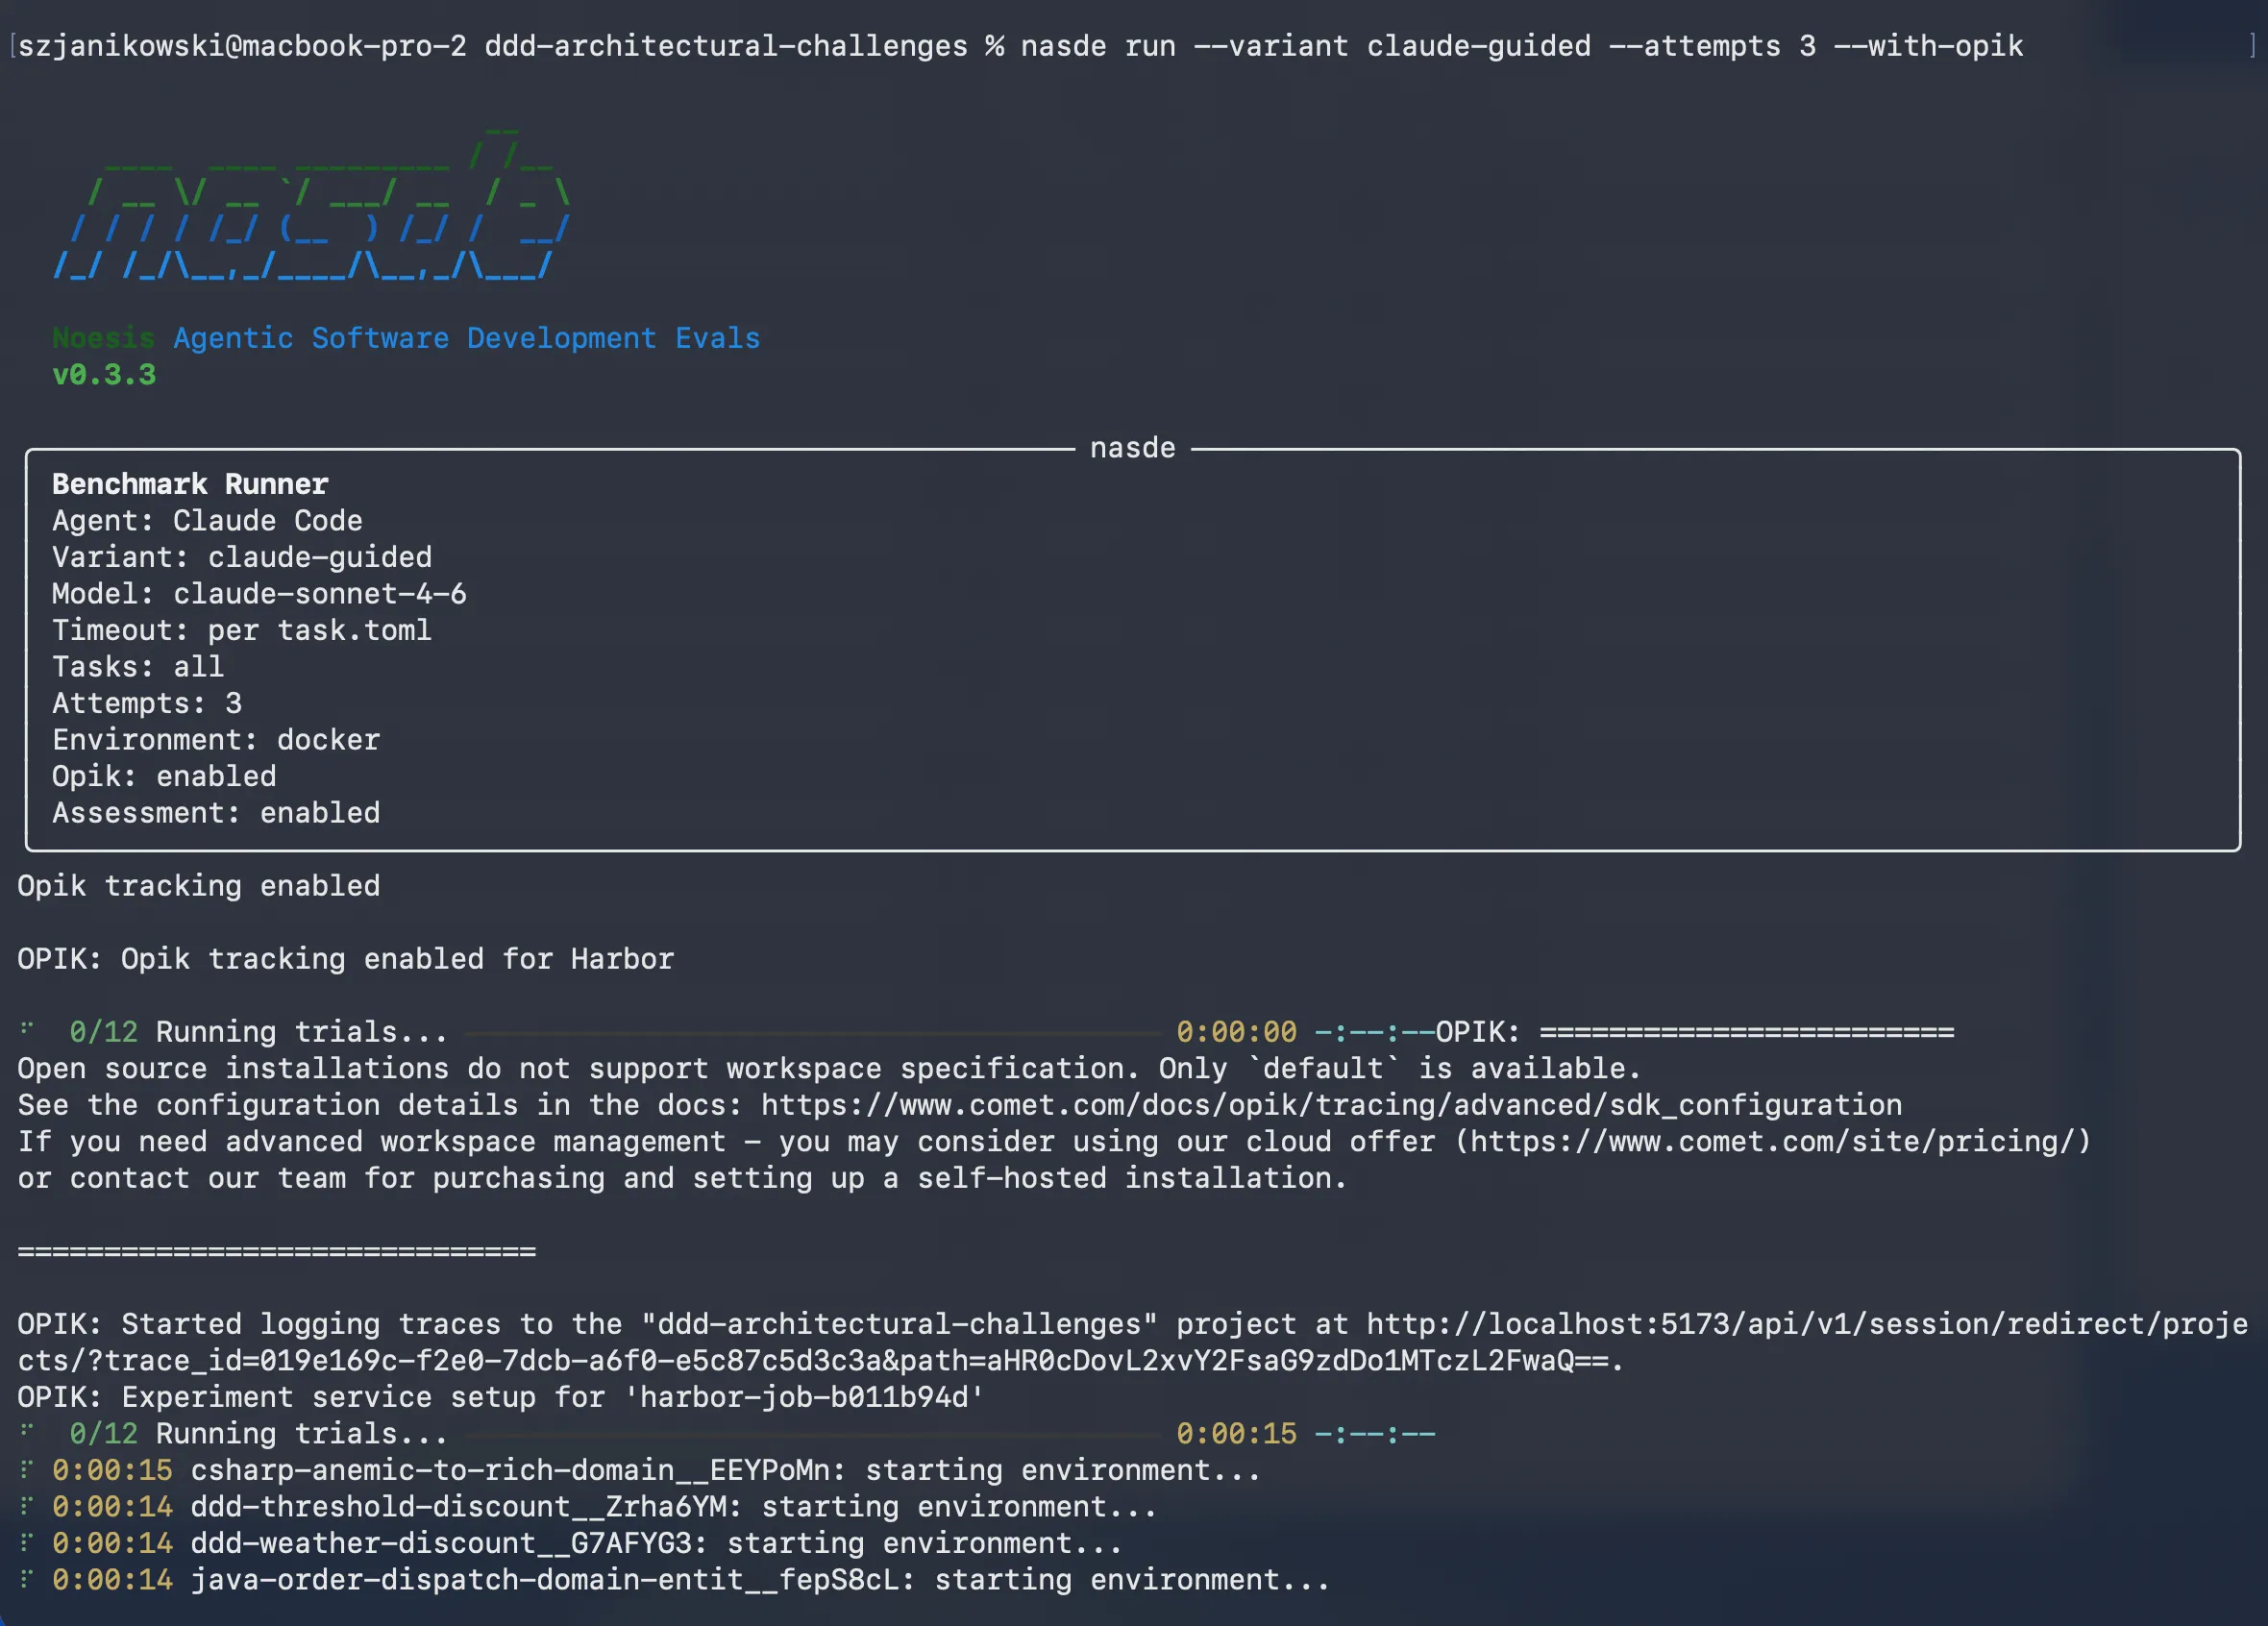
Section titled “What a run looks like”When you start a run, NASDE echoes the configuration so you know exactly what’s about to execute — agent, variant, model, attempts, whether Opik and assessment are on:
As trials complete, progress streams in; at the end NASDE prints a per-configuration summary table — one row per (agent, model, reasoning effort) group. Read it like this:
- Trials — how many times that configuration ran (set by
--attempts/-n). The sample size behind the mean. - Score — the normalized quality (0–1) as
mean ±std. The±stdis the spread between attempts (the agent writes different code each run). A single attempt showsmean (n=1)rather than a fake±0.00. - Tokens / Cost — total tokens and USD cost (see Token & Cost), with an inter-trial
±stdonce a group has 2+ trials.
The headline question — is configuration A better than B? — is answered by comparing rows and their spreads: a 0.05 gap means little if each row wobbles by ±0.08.
The jobs/ directory
Section titled “The jobs/ directory”Every run writes a timestamped job folder under jobs/ (gitignored). Inside, one folder per trial (<task>__<id>/), each containing:
| File | What it holds |
|---|---|
assessment_summary.json | The representative result — per-dimension mean / std / range, plus economics |
assessment_eval_<N>.json | Each individual reviewer pass (one per repetition) with full reasoning |
result.json / config.json | The trial’s reward, model, variant, and config |
agent/trajectory.json | The agent’s full tool-call trace |
verifier/ | The rough-test output — reward.txt (0/1) and test-stdout.txt |
Interpreting assessment_summary.json
Section titled “Interpreting assessment_summary.json”This is the file you’ll open most. It carries, per dimension, the mean, std (between repeated reviews of the same code — judge noise), min, and max, plus the normalized total and the token/cost economics. Two distinct noise sources live in different places, and keeping them apart is the point:
- Agent noise (the agent writes different code each run) → the
±stdin the run summary table, across trials. - Judge noise (the reviewer scores the same code differently) → the per-trial
stdinsideassessment_summary.json.
A gap you can trust is one that’s larger than both.
Beyond the local files
Section titled “Beyond the local files”- Opik dashboard — run with
--with-opikand the scores flow to an experiment tracker for browsing and cross-run comparison. See Authentication & Opik. - Export the essence —
jobs/is heavy and gitignored.nasde results-exportcopies just the scores, metrics, patch, and trajectory into any plain directory you want to keep. - Compare models visually — the quality-vs-cost Pareto frontier and per-dimension radars in Benchmark Results.